

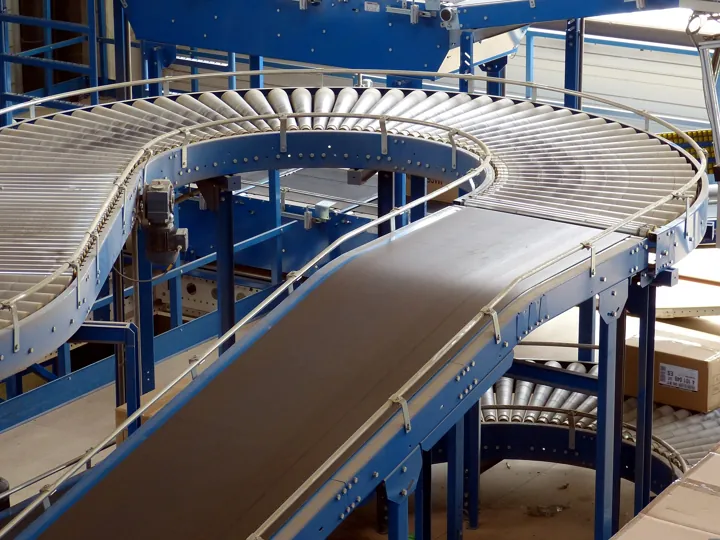
- Description
- Convoyeurs à rouleaux et à bande dans un entrepôt : un flux continu et automatisé
- Source
- falco · original page
- Licence
- CC0 Public domain
 Lead Time and Industrialization (DataOps)
DataOps applies continuous delivery principles to data: small, tested, replayable, reversible, observable changes. It differs from traditional DevOps through three…
Level: 🟢→🔴 · Theme code: DOP
Why this theme#
DataOps applies continuous delivery principles to data: small, tested, replayable, reversible, observable changes. It differs from traditional DevOps through three constraints: state (a database is not “redeployed,” it is migrated while preserving its data), volume (replaying is costly), and dependency on sources (deployment does not depend only on the team). A team without DataOps delivers slowly and fearfully: every deployment is an event, production diverges from development, and rollback exists only on paper. Detailed practices (pipelines, databases, testing) are in CI/CD for Data: Databases, Datamarts, Pipelines, and Reports and CI/CD: Continuous Integration and Delivery; measurement of code delivery is covered in the DL matrix — Continuous Integration and Delivery. Here, we assess the ability to deliver data changes safely and quickly.
What this theme measures#
- Axis: from manual delivery to continuous, safe, and measurable production deployment.
- Key indicator: end-to-end lead time for a data change (from validated request to production) and deployment failure rate.
- Unit: days or hours; % of deployments requiring a fix or rollback; restoration time. The four DORA metrics (deployment frequency, lead time for changes, change failure rate, time to restore — see Accelerate) are used as benchmarks.
The five levels#
| Level | Short name | Promise | Typical indicator (order of magnitude) |
|---|---|---|---|
| 1 | Manual | A change reaches production thanks to one person who knows the procedure. | Lead time in weeks; frequent failure; restoration in days |
| 2 | Repeatable | The same change is deployed the same way by any team member (scripts, kits). | Lead time in days; documented deployment |
| 3 | Versioned and tested | Every change comes from the repository, passes automated tests, and is deployed by a pipeline to identical environments. | Lead time < 3 days; ≥ 80% of deployments without fixes |
| 4 | Continuous and reversible | A validated change reaches production without intervention, with effect checks and verified rollback. | Several deployments per week; restoration < 1 h |
| 5 | On demand | Deployment is a non-event; the organization optimizes it through measurement and experimentation. | Daily deployment; failure < 5%; restoration in minutes |
Milestones by level#
| ID | Milestone | Verifiable evidence |
|---|---|---|
| PD-DOP-1.1 | A production deployment procedure exists and is written. | Dated procedure, followed during the last deployment. |
| PD-DOP-1.2 | The list of delivered objects is known for each release. | Release note with objects and version. |
| PD-DOP-1.3 | A test environment separate from production exists. | Named, accessible, refreshed environment. |
| PD-DOP-1.4 | A backup is taken before each deployment. | Dated backup trace before the last deployment. |
| PD-DOP-2.1 | Deployment scripts are replayable (idempotent): rerunning them breaks nothing. | Double execution of a script on a copy with no error or duplicates. |
| PD-DOP-2.2 | Deployment is performed in one action (script, kit) with no manual touch-up. | Observation of a deployment by someone who did not write it. |
| PD-DOP-2.3 | The version number is maintained and visible in the database or report. | Version query returning the number of the last deployment. |
| PD-DOP-2.4 | Delivered content is traceable to requests (tickets, changesets). | Each version linked to its work items. |
| PD-DOP-3.1 | All data code (SQL, model, configuration) is versioned in a repository (Version Control for Data: SQL and Power BI). | Complete repository; no object modified outside the repository (database ↔ repository comparison). |
| PD-DOP-3.2 | A pipeline runs build and automated tests on every change. | Build history with test results. |
| PD-DOP-3.3 | Environments are built through the same mechanism (no drift between test and production). | Schema comparison across environments with no unexplained differences. |
| PD-DOP-3.4 | Schema migrations preserve data and are tested on a representative dataset. | Migration run on a copy with volume and total checks. |
| PD-DOP-4.1 | Production deployment is automated and requires only an approval. | Deployment pipeline with an approval step. |
| PD-DOP-4.2 | A rollback is planned and has been rehearsed (not just described). | Documented restoration exercise, measured duration. |
| PD-DOP-4.3 | After deployment, an effect check (freshness, volumes, totals) validates the release. | Post-deployment checks in the pipeline, with archived result. |
| PD-DOP-4.4 | Delivery metrics (lead time, frequency, failure, restoration) are tracked. | DORA dashboard or equivalent over ≥ 3 months. |
| PD-DOP-5.1 | Deployments are daily or on demand, with small batches. | Measured frequency ≥ 1 per business day over one month. |
| PD-DOP-5.2 | Risky changes are isolated (progressive deployment, ephemeral environments, masked data). | Real case of an ephemeral environment or progressive cutover. |
| PD-DOP-5.3 | Flow bottlenecks are identified and continuously addressed. | Flow map with actions and measured gains. |
| PD-DOP-5.4 | Test environment costs are controlled (shutdown, reduced size). | Measurement of test environment cost (FIN). |
Detailed reading by level#
🟢 Level 1 — Manual#
- Signs: “we deploy Thursday night with Paul”; production contains objects unknown to development.
- Gain: zero tooling investment.
- Does not guarantee: identical deployment from one time to another; continuity when Paul is absent.
- Difficulty: 1/5 · Effort: 1/5.
🟢 Level 2 — Repeatable#
- Signs: a single installation kit; replayable scripts; version visible in the database.
- Gain: delivery no longer depends on one person; replays no longer corrupt data.
- Does not guarantee: absence of errors (no automated tests) or speed.
- Difficulty: 2/5 · Effort: 3/5.
-- Idempotence : un ajout de colonne rejouable sans erreur
IF COL_LENGTH('[fact].[Releve]', 'REL_COMMENTAIRE') IS NULL
    ALTER TABLE [fact].[Releve] ADD [REL_COMMENTAIRE] NVARCHAR(400) NULL;
🟡 Level 3 — Versioned and tested#
- Signs: everything is in the repository; a pipeline builds an empty database, runs migrations, executes tests; test and production share the same schema.
- Gain: regressions are detected before production; lead time drops because fear drops.
- Does not guarantee: interruption-free deployment or rollback.
- Difficulty: 3/5 · Effort: 4/5.
A datamart delivered via kits: before, 5 days between acceptance testing and production, with two deployments out of ten fixed urgently. After a pipeline that rebuilds the empty database, runs the partial load, then compares totals against the reference, lead time drops to 1 day and emergencies to one deployment out of twenty. The main gain comes from automatic totals acceptance testing (REC), not from the pipeline tool.
🟡 Level 4 — Continuous and reversible#
- Signs: single approval; rehearsed rollback; post-deployment effect checks; readable DORA metrics.
- Gain: changes become small and frequent, therefore less risky.
- Does not guarantee: rollback without data loss (a destructive migration remains irreversible); plan backward schema compatibility.
- Difficulty: 4/5 · Effort: 4/5.
🔴 Level 5 — On demand#
- Signs: daily releases; ephemeral environments with masked data; continuously optimized flow.
- Gain: business responsiveness; lower cost per change.
- Does not guarantee: relevance of what is delivered; speed without VAL only produces more useless reports.
- Difficulty: 5/5 · Effort: 5/5.
Partial achievement and rating#
Measure across the last ten deployments: a milestone is worth 1 if at least nine follow the practice, 0.5 if five to eight, 0 otherwise. For metrics (DOP-4.4), measurement must be calculated from events (pipeline history), not declared.
A “partial 5”: weekly pipeline-based releases with rehearsed rollback (4.x achieved), one ephemeral environment tested once (5.2 at 0.5), flow mapped but bottlenecks not addressed (5.3 at 0.5), test cost not measured (5.4 at 0). Score ≈ 4.0 + 0.5 × 0.99.
Going fast without testing: the pipeline automates error. Symptom: deployment frequency goes up, incidents too. Remedy: do not exceed the level of REC and QUA: DOP should never be more than two levels ahead of them.
Replaying a load that is not idempotent: duplicates, multiplied totals. Cause: insert without prior purge or replay key. Remedy: a process either purges or MERGEs on its key; test replay twice in a row.
Move to the next level#
Possible means (optional)
| Transition | Possible levers |
|---|---|
| 1 → 2 | A single kit, idempotent scripts, a version table. |
| 2 → 3 | Everything in a repository; a pipeline that builds a database from scratch; a representative test dataset (see Testing). |
| 3 → 4 | Automate deployment; rehearse restoration; add post-deployment checks; expand/contract for schema changes. |
| 4 → 5 | Reduce batch size; masked ephemeral environments; identify the bottleneck through flow mapping. |
Cross-cutting pitfalls: (1) False positive — green pipeline that tests nothing important. (2) Goodhart — maximizing deployment frequency by artificial splitting; also monitor failure rate. (3) State — treating a database like code without migration scripts: data is lost.
It writes migration scripts, pipeline templates, and test datasets, and summarizes a failure log. It does not measure your production risk: every generated script is replayed on a copy before production, and no secret appears in a prompt.
See also#
- Same matrix: 04 Contracts · 07 UAT · 10 Operations · 11 Cost and Value · README
- Other matrices: DL — Continuous Integration and Delivery · DL — Deployment and Operations · DL — Version Control and Branching · BI — Report Versioning and Industrialization
- Practice: CI/CD for Data: Databases, Datamarts, Pipelines, and Reports · CI/CD: Continuous Integration and Delivery · TFVC In Depth · Azure DevOps / TFS · project metrics
- Glossary · Rating: How to Read Scores, Ratings, and Legend
✻ Written by Claude Sonnet 5.5
