

- Description
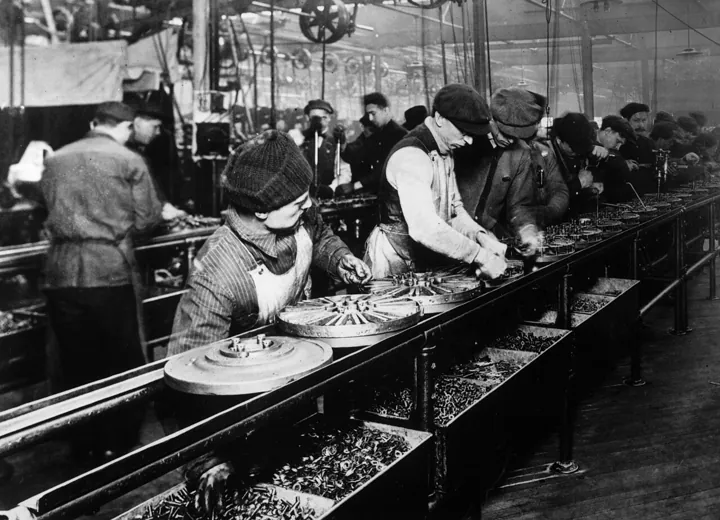
- An assembly line
- Source
- author not stated · original page
- Licence
- PD Public domain
 Product maturity
What makes a product mature, and how does that help the people who use it?
At a glance
- Two subjects: organization (processes, culture) and product (what it does and guarantees).
- Principle: the product's maturity carries part of the user's maturity.
- Tool: an inventory (in place, improvable, to do), not an assessment.
- Model: 14 dimensions, levels 0 to 5, 174 criteria.
On this page
The maturity matrices presented elsewhere describe the level of an organization. Another reading is missing, one closer to the day-to-day of a team building a tool: what is the maturity level of the product itself? And how does that maturity help users work with greater confidence?
1. Two subjects, two questions#
| Maturity of an organization | Maturity of a product | |
|---|---|---|
| What we look at | Processes, governance, culture, skills | What the product does and guarantees today, observably |
| The question | “Are we organized to succeed?” | “What can you count on, day to day, with this product?” |
| Low level | Tacit knowledge, undocumented practices, successes that depend on a few people | Files built by hand, copied from one workstation to another, checked “by eye” |
| High level | Practices defined, measured, continuously improved | Governed multi-source data, managed access, automated tests and deployments, incident anticipation |
| Who acts | Management, teams, communities | The team that designs, builds and operates the product |
| Examples here | The maturity matrices | The reference model for a BI product |
The two are related, but not interchangeable: a very mature organization may use a makeshift product, and a very mature product may land in an organization that doesn't use it.
2. What makes a product mature, day to day#
Five signs you can check without theory:
- You can rebuild it. Rebuilding the product or its data gives the same result, without depending on one person (repeatability).
- You can rely on it. Data is checked, access is controlled, security is applied (trust).
- You can understand it. Where a figure comes from, what a field means: the answer is written down and up to date (traceability).
- You can evolve it without fear. Tests and deployments make a change safe (evolvability).
- You are warned before suffering. Drifts are detected before they are experienced (anticipation).
3. How product maturity helps user maturity#
A product with low maturity makes its quality rest on the efforts of its users: vigilance, expertise, discipline. A mature product carries part of that maturity: the beginner is protected, the expert is equipped. Six mechanisms:
| Mechanism | Low-maturity product: the user compensates with… | Mature product: the product carries… | BI example |
|---|---|---|---|
| Safe defaults | Their vigilance and expertise | Protections applied without being asked | Everyone sees only their own scope, without filtering it themselves |
| Less variance | Their own calculations, their own files | Single, certified definitions and data | One “revenue”, one definition |
| Visible feedback | Permanent doubt: “is it up to date? is it right?” | Freshness, quality and origin displayed | Update date visible; you can trace a figure back to its source |
| Automated rigor | Individual discipline (“I didn't forget to check”) | Tests and deployments that don't depend on anyone's memory | No release if a test fails |
| Discoverability | A colleague to ask | A catalog, a glossary, up-to-date documentation | Finding out on your own “what does this field mean” |
| Progressive path | All or nothing: the tool is either simple or expert | Stages: view, customize, create, integrate | From the imposed dashboard to supervised creation |
The reverse loop#
The user also makes the product progress: measured usage, feedback and relays within teams feed the roadmap. A product reaches the higher levels only if its users send information back to it, hence the “measured usage” and “value-driven management” dimensions of the model.
A mature product makes error visible (displayed quality, tests, traceability): it gives the user the external feedback that corrects the optimistic self-assessment described on the Dunning-Kruger page.
Product maturity does not guarantee that of the users. Adoption (awareness, understanding, momentum, proficiency) remains a separate subject, described by Microsoft's adoption roadmap. The product creates the conditions; it does not do the learning in place of the people.
4. The six levels#
The reference model uses a common scale from 0 to 5. Each level can also be read from the user's side: what they still have to compensate for, and what the product takes care of.
| Level | Name | The user still has to… | The product takes care of… |
|---|---|---|---|
| 0 | Handcrafted | Build, check and share everything | Nothing |
| 1 | Local, tooled | Redo the extraction, check, send the files | The extraction from the management system |
| 2 | Shared | Know the source and the right version | A single publication, identified accounts |
| 3 | Industrialized | Handle exceptions, ask for help | Repeatability: flows, tests, access, monitoring |
| 4 | Integrated and governed | Interpret and decide | Multiple sources, scope-based rights, visible quality, integration, workflows |
| 5 | Autonomous | Decide on exceptions | Anticipation, corrections, automated processes |
5. One model per product type#
These pages provide a reference model for a decision-support (BI) product: 14 dimensions, six levels, 174 observable criteria. The structure (levels, dimensions, criteria, four statuses) can be reused as is for other products: data integration pipeline, business application, data platform. The inventory tool lets you identify, dimension by dimension, what is in place, what is improvable and what remains to be done.
6. An inventory, not an assessment#
The tool does not grade or rank: it describes what exists. Each criterion is an observable fact (“backups exist and are tested”), and its status says whether the fact is verified. The resulting level is a summary of the inventory, not a judgment on the team. Nothing is saved or sent: everything stays in the page, and you can download your inventory to reopen or compare it later.
7. What the model is based on#
The dimensions are inspired by recognized references. The levels and criteria are an original synthesis: it is not a standard, and it has not been empirically validated.
| Reference | What it brings to the model | Dimensions concerned |
|---|---|---|
| ISO/IEC 25010:2023 | Software product quality model: nine characteristics (including security, reliability, maintainability, compatibility) | Security, availability, integration, support, testing |
| OWASP ASVS 5.0 | Application security verification requirements, in three assurance levels, 17 chapters | Access, security |
| DORA (five delivery metrics) | Deployment frequency, lead time for changes, time to restore service, change failure rate, deployment rework rate | Deployment, testing |
| DAMA-DMBOK2 | Eleven data management areas, including quality, metadata, integration | Sources, quality, semantics, documentation |
| Microsoft Fabric adoption roadmap | Adoption of solutions and users, in stages | Usage, management |
| OWASP SAMM, TMMi, FinOps | Maturity matrices for secure development, testing and cloud costs (see the matrices) | Security, testing, availability |
8. Limitations and precautions#
- A criterion is an observable judgment, not a measurement. Two teams may answer it differently: ask for evidence or a demonstration.
- When the level becomes a goal, you optimize the level rather than the product (Goodhart's law). Use the level to decide what to do, not to compare yourself.
- Level 5 is not a universal goal: each dimension has the level that suits its context.
- Don't compare products with each other using these levels: they have neither the same context nor the same constraints.
- A mature product is not a useful product: maturity says how the product is maintained, not whether it meets the need.
- Self-declaration is optimistic: see the Dunning-Kruger effect.
Sources and verification#
- ISO/IEC 25010:2023 — Product quality model (SQuaRE) — software product quality model, nine characteristics
- OWASP — Application Security Verification Standard — three verification levels, 17 chapters in version 5.0
- DORA — Software delivery performance metrics — software delivery metrics
- DAMA International — DMBOK — data management, quality, metadata
- Microsoft Learn — Fabric adoption roadmap: maturity levels — organizational, user and solution adoption
