

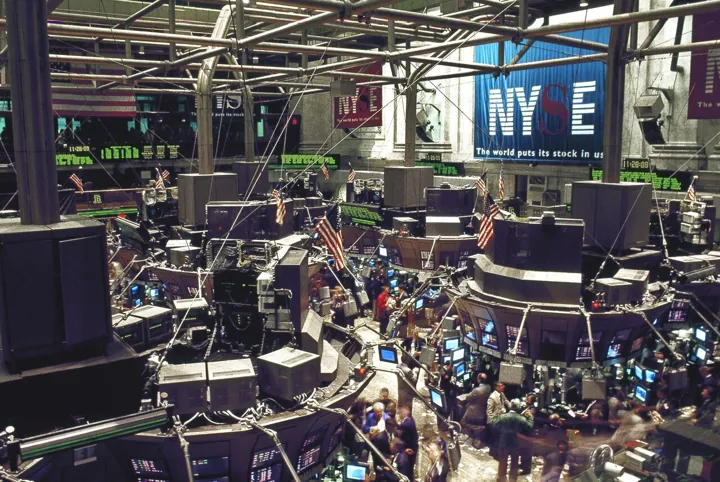
- Description
- The trading floor of the New York Stock Exchange
- Source
- Carol M. Highsmith · original page
- Licence
- PD Public domain
 Loss aversion
Losing 100 hurts more than gaining 100 pleases, and this asymmetry is enough to block many changes that would actually be favorable.
In brief
- What: for an equal amount, a loss is felt more strongly than a gain; on average, about twice as much.
- Why: we evaluate outcomes relative to a reference point (the current situation), and losses weigh more than gains above that point.
- Detect: we list what we lose by changing, never what we lose by not changing; the promised benefits must be “huge” to be taken seriously.
- Avoid: put a figure on the cost of inaction, reframe losses as gains (and vice versa) to test the decision, protect the assets that are really useful.
Definition#
 Illustration inspired by the person
 Fictitious illustration
 Fictitious illustration
Loss aversion is the tendency to feel a loss more intensely than a gain of the same size. It is one of the pillars of prospect theory, proposed by Daniel Kahneman and Amos Tversky in 1979. In this theory, an outcome is not evaluated in absolute terms, but as a gain or a loss relative to a reference point, most often the current situation.
In their 1992 estimates, Tversky and Kahneman found a loss aversion coefficient close to 2.25 (the median value among their participants). Estimates vary by study and situation; a recent review of the literature (Brown et al., 2024) gives an average close to 2, with wide dispersion.
It does not say that people are afraid of all risk: they tend to avoid losses, and can even become risk-takers to avoid a certain loss (“I'll go for broke rather than admit the loss”).
The mechanism#
Prospect theory rests on three ideas:
- The reference point: what we own or what we expect defines zero. An outcome is a gain or a loss relative to that zero, not according to its absolute value.
- Diminishing sensitivity: going from 0 to 100 counts for more than going from 1,000 to 1,100, for gains and losses alike.
- Asymmetry: the curve for losses is steeper than the one for gains. Losing 100 “is worth” more, on average, than gaining 100.
When we change tool, method or architecture, the losses are concrete, immediate and attributed to the person who decides (relearning habits, features that disappear, risk of incidents); the gains are future, uncertain and diffuse. The balance tips toward the status quo, even if, on paper, the gains win out.
The value function of prospect theory
Loading the chart…
View the data
| Felt value | |
|---|---|
| −200 | -238.3 |
| −100 | -129.5 |
| −50 | -70.4 |
| −25 | -38.2 |
| 0 | 0 |
| 25 | 17.0 |
| 50 | 31.3 |
| 100 | 57.5 |
| 200 | 105.9 |
Offer someone a coin toss: they win 100 euros on heads and lose 100 on tails. The expected gain is zero, and most people refuse. To accept, they generally ask for a potential gain markedly larger than the possible loss, often around double. This is what Kahneman and Tversky (1979), and the work that followed, measure in various forms.
Where it shows up#
In project management#
- Technical migration: the team lists what it will lose (“feature X will no longer exist as is”, “we lose our scripts”) without listing what it costs to stay on a platform at end of support.
- Rebuild: users reject the new interface because every small difference is experienced as a loss, even if the whole is simpler.
- Tool change: the announced gain (“20% time saved”) is judged insufficient against the risk of losing history, habits and shortcuts.
- Removing a feature: even when rarely used, it is defended energetically as soon as someone proposes to remove it (see the endowment effect).
- Negotiation with a client: removing an item from the scope is experienced as a far heavier loss than not obtaining a new item of the same value.
- Testing and go-live: we focus on the risk of visible regression (a loss) rather than on the defect that will remain as long as we change nothing.
In management#
- Reorganization: everyone compares the new org chart with their current position; the losers (scope, status, team) speak up more strongly than the winners. The project manager underestimates this balance of power.
- Compensation: a lost bonus is felt more harshly than an equivalent bonus gained; removing a benefit has a motivational cost greater than its value.
- Delegation and change of role: a manager keeps a task they master, for fear of losing control over the result.
- Review meeting: a goal presented as “avoid losing the bonus” has more effect than “earn the same bonus”, which is a lever but also a risk of excessive pressure (see the framing effect).
Famous cases#
Investors who hold on to their losses 1998#
Bias at play: loss aversion, disposition effect.
What happened. The economist Terrance Odean (1998) analyzed the trades of about 10,000 accounts at a US discount broker between 1987 and 1993. For each investor, he compared how often they sold a stock whose price was above the purchase price with how often they sold one whose price was below. Winning stocks were sold more often (14.8% of opportunities) than losing ones (9.8%), although, setting aside tax considerations, nothing justifies holding on more to the stocks that lose. This is the disposition effect, which is linked to loss aversion: selling at a loss forces us to “realize” the loss.
What this illustrates
Investors keep what has lost “until it gets back to even” and sell too early what has gained. The same reflex exists in projects: we keep a component, a tool or a license “at a loss” because parting with it would make the loss show, even if the best decision, seen from today, is to part with it. The study covers individual investors in the United States: the disposition effect has other possible explanations (belief in mean reversion, portfolio rebalancing).
The mugs of Kahneman, Knetsch and Thaler 1990#
Bias at play: loss aversion, endowment effect.
Daniel Kahneman, Jack Knetsch and Richard Thaler (1990) handed out mugs at random to half of a room of students. The owners had to say at what price they would sell their mug; the others, at what price they would buy it. If we were not attached to what we own, about half of the mugs should have changed hands. Yet trades were markedly fewer, and the selling price asked was around twice the buying price offered. Parting with an object we have been given is experienced as a loss, which the price of the exchange must compensate.
What this illustrates
The experiment concerns an ordinary object obtained a few minutes earlier: the attachment therefore comes from possession, not from the object's value. In a project, what the team already owns (a tool, an architecture, scripts) is valued beyond what one would get from it from an outside point of view. The result has been debated since (see Limits): the magnitude depends on the situation and on the participants' experience.
Warning signs#
- The analysis of a change contains only one column: what we lose.
- “It works well enough, why change?”: the cost of not changing is never quantified.
- The announced benefits must be “huge” to be taken into account; the drawbacks, even minor ones, count in full.
- Removing a feature provokes reactions out of proportion to its actual use (low usage statistics).
- We keep a component “because we can't lose it” or “so as not to lose what we've gained”.
- We postpone a decision “so as not to take a risk”, without looking at the risk of inaction (obsolescence, end of support, departure of skills).
Avoidance reflexes#
- Put a figure on the cost of inaction. For each change refused, write down what it costs to stay: support ended, growing debt, time lost every week, security risk.
- Test the reverse framing. Reformulate the decision as a gain (“we gain”) and then as a loss (“we lose”); if the conclusion changes, the framing matters more than the facts.
- Take the opposite starting point. “If we were already on the new solution, would we agree to move to the old one?” This reversal of the reference point neutralizes part of the asymmetry.
- Distinguish real losses from felt losses. For each thing we “lose”, ask: is it used? by whom? how many times a month? Keep what serves, accept the rest.
- Compensate for visible losses. A support plan (data migration, functional equivalent, training) reduces the felt loss, which is more effective than repeating that the gain will be large.
- Break the change into pieces. Reversible steps, with the possibility of rolling back, make the potential loss less final.
- Look at all the decisions together, not each one. Out of ten reasonable changes, accepting half of them pays more than refusing them all: loss aversion is weaker when we reason in terms of a portfolio.
With AI: detect, remedy, mitigate#
AI can help to rebalance a file by listing what inaction costs and by rephrasing the arguments in both framings. It does not feel loss, but it follows the framing you give it: explicitly ask it for both columns, otherwise it will mostly develop the one in your question.
Detect#
- Spot the missing columns in an impact analysis: cost of inaction, benefits, risks of not changing.
- Pick out the vocabulary of loss (“lose”, “sacrifice”, “give up”) in minutes.
- Compare the actual usage of a feature with the place it takes up in the debates.
Fix#
- Produce a symmetric analysis: losses and gains of the change, losses and gains of staying.
- Estimate the cost of inaction over twelve and twenty-four months, with the assumptions.
- Propose a support plan that answers the losses cited (equivalents, migration, training).
Mitigate#
- Have the same decision rephrased as gains and then as losses.
- Have it play the reversed starting point: “we have just migrated, should we go back?”
- Have it list the imagined losses of the opponents and distinguish those that are real.
Prompts to build into your routines#
1. Symmetric analysis of a change. Before deciding to migrate, change tools or remove a feature.
Here is the situation: [current solution, planned change, constraints, schedule].
Build a four-box table: (1) what we lose by changing, (2) what we gain by changing, (3) what we lose by not changing, (4) what we gain by not changing.
For each line, give: the order of magnitude (in days, euros or risk), the time it takes to appear and your confidence level. Do not invent any figure I have not given you: point out what needs to be measured.
Conclude with the decision you would make if we were starting from the current situation, then if we were coming from the new one.
2. Checking the reverse framing. When a decision to stay put seems obvious.
The following decision is under discussion: [decision]. Here is the current argument: [text].
1. Rewrite the argument by framing the same facts as <em>gains</em> if the text talks about losses, and as <em>losses</em> if it talks about gains.
2. Say whether the conclusion holds in both framings.
3. List the “losses” cited in the argument and, for each, what would need to be checked (actual use, frequency, alternative) to know whether it is real.
How to build them in#
- Before the decision: prompt 1 produces the four-box table; the team corrects the values with its own data.
- In a meeting: prompt 2 is used to check that the conclusion does not depend on the way it is presented.
- Afterwards: compare the forecast of losses with what actually happened, to calibrate future decisions.
Precautions#
- The figures AI produces are groundless orders of magnitude if you have not given it data: measure before deciding.
- If you present the change as risky, AI will develop the risk; present both options neutrally.
- It may invent references or “coefficients”: the figure of 2.25 comes from one specific study and does not apply as is to your context.
- Do not pass confidential information (contracts, headcount, compensation) to an unauthorized tool.
Limits#
- The coefficient of about two is an average: it varies greatly across people, amounts and contexts; for small sums, some studies find almost no asymmetry (Gal and Rucker, 2018; Yechiam, 2019), while others defend the robustness of the phenomenon (Mrkva et al., 2020; Brown et al., 2024).
- Some famous results have been challenged: the study of New York taxi drivers (Camerer et al., 1997), who were said to treat a target daily income as a reference, was called into question by other analyses (Farber, 2005).
- Not changing is not always a mistake: a change has real transition, learning and risk costs, and keeping what works is often reasonable. The bias begins when these costs are over-weighted, or when the cost of inaction is not examined.
- Loss aversion, status quo bias and the endowment effect overlap and are sometimes confused; loss aversion is one of the mechanisms proposed for the other two, but not the only one.
Sources and verification#
- Kahneman & Tversky (1979), “Prospect Theory: An Analysis of Decision under Risk”, Econometrica — the founding article.
- Tversky & Kahneman (1992), “Advances in prospect theory: Cumulative representation of uncertainty”, Journal of Risk and Uncertainty — median coefficient of 2.25 and exponent of 0.88.
- Kahneman, Knetsch & Thaler (1990), “Experimental Tests of the Endowment Effect and the Coase Theorem”, Journal of Political Economy — the mug experiment.
- Odean (1998), “Are Investors Reluctant to Realize Their Losses?”, The Journal of Finance — disposition effect (14.8% and 9.8%).
- Brown, Imai, Vieider & Camerer (2024), “Meta-analysis of Empirical Estimates of Loss Aversion”, Journal of Economic Literature
- Gal & Rucker (2018), “The loss of loss aversion: Will it loom larger than its gain?”, Journal of Consumer Psychology, 28(3), 497-516.
- Mrkva, Johnson, Gächter & Herrmann (2020), “Moderating loss aversion: Loss aversion has moderators, but reports of its death are greatly exaggerated”, Journal of Consumer Psychology, 30(3).
- Camerer, Babcock, Loewenstein & Thaler (1997), “Labor Supply of New York City Cabdrivers: One Day at a Time”, The Quarterly Journal of Economics
- Yechiam (2019), “Acceptable losses: The debatable origins of loss aversion”, Psychological Research, 83, 1327-1339.
- Farber (2005), “Is tomorrow another day? The labor supply of New York City cabdrivers”, Journal of Political Economy, 113(1), 46-82.
- Kahneman (2011), Thinking, Fast and Slow, Farrar, Straus and Giroux — chapter on loss aversion.
See also#
Combines with, or reinforces#
These biases feed each other.
Related biases#
Variants or cousins: not to be confused.
Counterweights and related reflexes#
What neutralises it.
- Le calcul explicite du coût de ne pas changer (concept or method, no page)
- The pre-mortem
- The devil's advocate
