

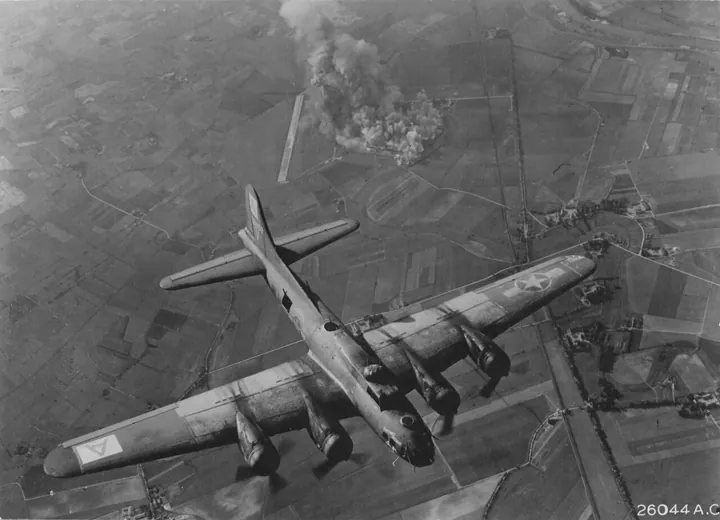
- Description
- A B-17 bomber over Europe
- Source
- author not stated · original page
- Licence
- PD Public domain
 Survivorship bias
Failures stay quiet, disappear from statistics and conferences; what we observe is already the result of filtering.
In brief
- What: we study only cases that “passed selection” (companies still around, delivered projects, planes that returned) and draw conclusions about the entire population.
- Why: failures are invisible (no book, no conference, no row in the database), while successes are loud. We do not see what is missing.
- Detect: a “good practice” is drawn from a sample of successes, without anyone asking how many also applied it and failed.
- Avoid: ask who is missing from the data, look for failures, compare with a control group, and reason about the initial population.
Definition#
 Fictitious illustration
Survivorship bias (survivorship bias) is a selection error: we draw conclusions from a sample made up only of cases that “survived” a filtering process, while eliminated cases are no longer visible. The sample is not representative of the starting population, and its properties are partly the result of the filtering itself.
The best-known form is the search for “success factors”: we examine companies that succeeded, note what they have in common (a stubborn founder, a culture, a practice), and infer that these traits cause success. Yet companies that failed often had the same traits, but no one interviews them.
The mechanism#
Two phenomena combine:
- A real filter: the process itself eliminates cases (bankruptcies, project cancellations, shot-down planes, rejected candidates, discontinued products). What remains is already filtered.
- A visibility filter: only successes are told and published. Failures are archived, forgotten, or hidden; no one writes “how we applied the right method and failed.”
The brain, which works with what is in front of it, does not flag what is absent. It treats the visible sample as if it were the whole (see also Availability heuristic).
Where you encounter it#
In project management#
- Benchmarks and case studies: “companies that adopted this method have good results”; but how many adopted it, failed, and no longer respond to surveys?
- Feedback: we analyze completed projects, not those stopped along the way; causes of cancellation do not appear in success indicators.
- Conference good practices: speakers are those whose approach worked; teams that did the same thing without success are not invited.
- Production data: a dashboard that counts only closed tickets, customers who did not churn, or users who did not abandon the app gives an overly favorable picture.
- Codebases and modules: “this module has lasted ten years, it is solid”; fragile modules may already have been rewritten or removed.
In management#
- Top-performer profile: we examine managers in role to describe “what it takes to succeed,” without looking at those with the same traits who left or were pushed out.
- Inspiring career paths: famous leaders who dropped out or took huge risks are cited; the many others who did the same and failed are not told.
- Satisfaction surveys: they reach only people still on the team; those who left because of the problem do not answer them.
- Evaluation of a training or mentoring program: we measure those who completed it, not those who dropped out.
A dashboard that shows only delivered projects, active customers, or viewed reports ignores those that were abandoned, lost, or never opened. Keep exited entities in the model (status, exit date) so you can also count failures.
Famous cases#
Abraham Wald and World War II bombers 1943-1945#
Bias at work: survivorship bias. The popular story is simplified; see what is established.
What is established. During World War II, mathematician Abraham Wald (born in 1902 in Cluj, then in Hungary, died in 1950) worked at Columbia University's Statistical Research Group, which advised the U.S. armed forces. He studied aircraft vulnerability based on damage recorded on planes that returned from missions. His contribution was recognizing that this sample was biased: planes hit in critical areas do not return, so those areas are underrepresented in observed damage. He built statistical methods to estimate, from returned aircraft alone, the damage distribution across all aircraft engaged. His period memoranda were published later, and the method is presented by Mangel and Samaniego in the Journal of the American Statistical Association (1984).
What is embellished. The most widespread anecdote is that of a plane diagram covered in red dots, which Wald supposedly read in reverse: “armor the places with no impacts.” It captures the idea but is simplified: Wald's work is a statistical estimation method (assumptions about shoot-down probability by hit zone), not a simple reading of a drawing; the image of a plotted diagram read backward is a convenient reconstruction and should not be taken as an exact account of what happened.
What this illustrates
The question is not “what does the data show?” but “why is this data the only data I can see?”. In feedback, canceled projects, dissolved teams, and departed customers play the role of planes that did not return: they are the ones that show where the system is vulnerable.
“Good to Great”: the eleven exceptional companies 2001-2008#
Bias at work: survivorship bias, selection on outcome, halo effect.
What happened. In Good to Great (2001), Jim Collins selected, among 1,435 companies, eleven that significantly outperformed the market over a long period, then looked for what they had in common (“Level 5” leadership, discipline, etc.). Selection is done based on the outcome; practices are then read backward to explain that outcome. Several of these companies faced serious difficulties after the study period: Circuit City went bankrupt in 2008 and was liquidated, and Fannie Mae was placed under U.S. government conservatorship in September 2008. Phil Rosenzweig (The Halo Effect, 2007) and Daniel Kahneman (Thinking, Fast and Slow, 2011) cite this kind of work as an example of retrospective explanations of success where luck is underestimated.
What this illustrates
A sample chosen because it succeeded does not prove its practices cause success: to know that, you need companies with the same practices but without success, and to follow both groups before the outcome is known. Applied to an IT project: a method from “the best teams” is evidence only after examining teams that applied it without success.
Detection signals#
- All cited examples succeeded, and no one cites a failure with the same practice.
- The starting population is unknown: “how many tried?” remains unanswered.
- The data contains only completed projects, active customers, closed tickets.
- The identified causes of success are very general (“perseverance,” “a good team,” “a vision”).
- Surveys reach only those who are still there.
Avoidance reflexes#
- Ask “who is missing?” Before interpreting a sample: which cases were filtered out, and by what mechanism?
- Go back to the starting population. How many projects, companies, or candidates were there at the start? What proportion succeeded? A practice's success rate is the number of successes divided by the number of those who applied it, not just the numerator.
- Actively look for failures. Review abandoned projects, departures, and lost customers. A review of stopped projects is often worth more than a review of delivered projects.
- Compare with a control group. A practice that works for survivors must be compared with that same practice among those that were filtered out.
- Be wary of generic causes. A trait that also appears among losers does not explain victory.
- Keep a failure log. Track decisions, abandonments, and their reasons so the information does not disappear with the teams.
- Distinguish luck from method. Ask how much of the outcome is due to luck: if many teams try, a few will succeed by chance.
With AI: detect, fix, mitigate#
AI helps ask the missing question (what data is missing?) and imagine filtered-out samples. But it is itself trained on texts that mostly tell success stories, and it may reproduce the bias by offering “success formulas.” It does not replace collecting failure data.
Detect#
- Identify in a report or benchmark the sample's selection mechanism and what it excludes.
- Flag causal conclusions drawn only from successes.
- List missing populations in a study (left, abandoned, non-respondents).
Fix#
- Propose data sources on failures (stopped projects, departures, incidents).
- Design a control group or comparison table with and without the practice.
- Rephrase a conclusion with the starting population and a success rate.
Mitigate#
- Generate a lessons learned checklist that includes abandoned projects.
- Draft the exit questionnaire for people leaving the team.
- Have it summarize known counterexamples to a “good practice” before adopting it.
Prompts to integrate into your workflows#
1. Who is missing from the data?. Use before adopting a conclusion drawn from successful examples.
Here is a conclusion we want to adopt: [conclusion], based on these examples: [description of the cases studied and how they were selected].
Answer the following questions without inventing data: 1) what selection mechanism may have filtered out cases before the study? 2) who is missing from the sample? 3) how could this absence distort the conclusion, in both directions? 4) what data should be collected to bring the missing cases back in?
2. Review of a lessons learned report. To prepare a lessons learned report that is not limited to successes.
I am preparing a lessons learned report on [domain: projects, migrations, hiring…]. Help me define the full population scope: successful cases, abandoned cases, silent failure cases, undeclared cases. For each category, suggest a possible data source, the person to interview, and three questions to ask. Specify what I will not be able to measure.3. Success rate of a practice. When someone tells you “teams that do X succeed.”
I am told that teams that use [practice X] succeed. Explain how to establish this practice's actual success rate: which populations to compare (with and without X), what other factors could explain success, what sample size is needed, and how to avoid looking only at survivors. Do not provide any figures about the practice itself.How to integrate them#
- Before adopting a practice: run prompt 1 on the article or presentation that recommends it.
- Lessons learned: prompt 2 builds the collection plan, including abandoned cases.
- Architecture or method decision: prompt 3 helps formulate what is not yet known.
Precautions#
- An AI that lists “the success factors of top companies” reproduces the bias: do not ask it for formulas; ask it to help you find who is missing.
- The references and numbers it gives may be invented: verify the source.
- Do not submit personally identifiable project or departure data to an unauthorized tool.
Limits#
- Studying successes is not useless: the bias begins when you infer a cause without comparing to filtered-out cases.
- Sometimes failures truly cannot be found: in that case the bias cannot be corrected, but it must be stated in the conclusions.
- The bomber story is widely shared in a simplified form; this text distinguishes what is documented (Wald's method) from anecdote.
- Critiques of Good to Great focus on method and causality; they do not mean that none of the described practices has value.
Sources and verification#
- Mangel, M. & Samaniego, F. J. (1984), “Abraham Wald's Work on Aircraft Survivability,” Journal of the American Statistical Association, 79(386), p. 259-267, DOI 10.2307/2288257 — the method and its assumptions.
- Wikipedia (English), “Abraham Wald” — biography and recap of work on aircraft survivability.
- Wikipedia (English), “Survivorship bias” — overview and examples.
- Collins, J. (2001), Good to Great: Why Some Companies Make the Leap… and Others Don't, HarperBusiness.
- Rosenzweig, P. (2007), The Halo Effect… and the Eight Other Business Delusions That Deceive Managers, Free Press.
- Kahneman, D. (2011), Thinking, Fast and Slow, Farrar, Straus and Giroux — discussion of luck in business success.
See also#
Related biases#
Variants or cousins: not to be confused.
Counterweights and related reflexes#
What neutralises it.
- L'analyse des échecs et des abandons (concept or method, no page)
- Reference class forecasting
- The devil's advocate
